Interpreting nucleotide BLAST results
Why blastn nucleotide sequences?
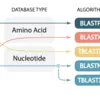
Nucleotide BLAST (blastn) compares one or more nucleotide query sequences to a database of nucleotide sequences. This means comparing DNA to DNA, or DNA to RNA. It is used to compare non-coding sequences, coding sequences, predicted transcripts, messenger RNAs, or genomes.
But blastn is not always the most appropriate approach. BLAST has four other BLAST algorithms. The others (blastp, tblastn, tblastx and blastx) are more appropriate when comparing amino-acid sequences directly or when comparing sequences of nucleotide and amino acids.
blastn can accept DNA sequences (A, T, G, C) or RNA sequences (A, U, G, C). Query sequences are typically provided in FASTA format, but SequenceServer can also take FASTQ sequences as BLAST input.
Understanding the BLAST report
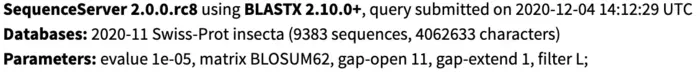
blastn outputs a standard report that has lots of useful information. This format is mostly consistent across different BLAST algorithms. Here is an example of a SequenceServer blastn alignment.

- The
blastnalgorithm (nucleotide vs nucleotide) was used with one query, searching in eight databases. - SequenceServer lets users download alignment information, including FASTA sequences, alignments, tabular outputs, and Conserved Domain hits.
- SequenceServer enables sharing choices such as copying the URL of the BLAST results and emailing the results.
- The subject has the accession XM_039455050.1. It is the fifth hit for the query and has a length of 4,456 bp.
- SequenceServer gives options to select and view sequences, download subject FASTAs, download alignments, and view the subject’s NCBI taxonomy.
- SequenceServer allows users to export the SVG or PNG of the graphical alignment in (7).
- Graphical summary of alignment. The query on top has 1.5 kbp, and the subject below has 4.5 kbp. The coloured segment between the query and subject marks the region of the two sequences that align, which is shown in more detail in (9).
- BLAST metrics of an alignment. Bit Score (which is a BLAST scoring metric; higher is better), the expected E-value, the number of perfect matching identities, the number of matches, and the number of gaps in the whole alignment.
- This is the alignment region highlighted in the coloured block (7). Below are more details about
blastnalignments.
How are blastn alignments depicted?
blastn nucleotide alignments have a simple format.
- BLAST alignments only show the aligning regions of the query and subject sequences.
- The query sequence is at the top, and the subject sequence is at the bottom.
- Alignment positions are given at the start and end of the alignment for each sequence.
- The query and subject have a “
|” between nucleotide matches. - Mismatches just have a space “ ”.
- BLAST uses a dash “
-” for alignment gaps. BLAST does not consider gaps in the alignment length.
Query      1 CTGTAACTGAATCGGATCCGG---GGCAGGTCGTGACATTATTATTTCGTGTT 51
             ||||  |  || |||||||||   ||||||||||||      ||||    |||
Subject   10 CTGTGCCCTAAACGGATCCGGGTAGGCAGGTCGTGA------TATTGACCGTT 58
Various metrics of a blastn alignment
Metrics are useful for understanding the quality and features of an alignment. BLAST outputs a standard list of the most important metrics. These are the Score, E-value, Identity, Gaps and Strand.
Score: 6218.40 (6895), E value: 0, Identity: 3462/3474 (99.7%), Gaps: 12/3474 (0.3%), Strand: + / +
- Score: BLAST calculates the alignment score based on the number of matches, mismatches, and gaps. The higher the score, the more sequence similarity between the query and subject.
- E-value: Is an estimate of the Expected number of random alignments with a particular score or better that could be found by chance in a given database search. E-values close to zero correspond to more significant alignments.
- Identity: This refers to the percentage of identical matches between the query and subject over the aligned region. BLAST calculates identity percentage by dividing the number of matches by the total number of positions, including gaps, in the aligned region and then multiplying by one hundred to obtain a percentage.
- Gaps: BLAST shows the number of gaps in the alignment. BLAST first opens a gap and then extends the gap. Since gaps are penalised, generating gaps must result in more matches in the alignment than without the gaps. Gaps can result from things like INDELs (insertion/deletions), aligning isoforms of the same gene or aligning genes (just exons) to genomes (which have exons and introns).
- Strand: This refers to the orientation of the query and subject sequences. BLAST uses “
+” (“plus”) to denote that the sequence in the alignment is in the same orientation as it is in the database, or “-” (“minus”) to denote when the sequence is in the reverse-complementary orientation compared to the entry in the database. Example 1 covers more information about the BLAST strand.
Example 1 - Understanding the orientation of alignments
DNA is a double-stranded molecule, and each strand is read and transcribed from the 5’ to 3’ direction. These two strands are known as the “forward” and “reverse” strands. Genomic DNA encodes genes on both strands.
While biologically, the forward/reverse orientation relates to replication/transcription, BLAST uses “plus”/“minus” (+/-) to relate to the orientation of the sequence in the FASTA. Importantly, we only give one strand when we store our sequences in FASTA format.
Often, we might have the messenger RNA (mRNA) sequence (which is single-stranded) of a gene and want to find where it is encoded in the genome (which is double-stranded). Usually, mRNA sequences are stored in the BLAST plus orientation in a database. This makes sense since the single-stranded mRNA is read to make a protein from one direction. However, when we store a genome, we only put one strand in a database. This means that the mRNA sequence might align with the genome, with the genome sequence either in a plus or minus orientation. So, how do we see this in the BLAST output?
The SIR2 gene in baker’s yeast Saccharomyces cerevisiae (S. cerevisiae) encodes a NAD-dependent protein deacetylase involved in gene silencing and longevity regulation. SIR2 is encoded on chromosome IV, but how is it oriented relative to the FASTA sequence of the chromosome?
We can easily find this out using blastn to align the SIR2 sequence to the genome. The graphical overview shows that the 1.7 kb mRNA sequence maps to a region close to 0.4 Mbp of the 1.5 Mb chromosome. However, notice that while the mRNA sequence starts at 1 bp on the left, the chromosome starts at 1 bp on the right. This shows that SIR2 is aligning with the chromosome’s reverse strand of the FASTA sequences. We can also see that the strand information is plus/minus (+/-), where “+” represents the plus orientation of the mRNA, and “-” represents the chromosome’s minus orientation. Therefore, the SIR2 gene in S. cerevisiae is on the minus strand compared to the chromosome IV FASTA sequence.

Example 2 - The query sequence has multiple alignments to the reference genome
When performing BLAST analyses, one query can align to multiple regions, e.g., within a genome. Understanding the implications of these results and which of these hits are relevant to your analyses is critical. For example, a query gene sequence may align to multiple genomic locations. Do these multiple hit locations correspond to gene duplications, different genes with similar functional domains, or genome assembly artefacts?
Let us look at the SKI2 gene in S. cerevisiae, which encodes a putative RNA helicase involved in RNA regulation. The SKI2 gene is found in the plus orientation on chromosome XII. We can check this using blastn to align the SKI2 gene sequence to the S. cerevisiae genome. However, the blastn output shows that there are multiple hits. One is where we expect on chromosome XII, and the other hit is on chromosome X.

We have blastn information that helps us understand the difference between these hits, including the query coverage, total score, E-value, and percentage identity.
- Query coverage in BLAST refers to the percentage of the query sequence that the alignment covers with the subject sequence in the database. One of the alignments has 100% coverage, while the other only has 15%.
- As mentioned above, total score is BLAST’s way of scoring alignments. In this example, one alignment has a larger score than the other, which indicates a better alignment.
- The E-value for one alignment is 0, suggesting we would expect by chance not to see an alignment this good in our experiment. In comparison, the other alignment has 1.79x10-41, showing a low expectation of finding similar alignments by chance, but it is still not as strong as the first alignment.
- The percentage identity for the alignment on chromosome XII is 100%, and on chromosome X is 69.2%, showing that the alignment is perfect on chromosome XII. The lower identity alignment could be a paralog or gene with a similar functional domain.
Let us take a closer look at the alignments for each hit. The strongest hit shows the complete length of the gene sequence aligns with 100% similarity to the genome on chromosome XII, in the plus/minus orientation.

In comparison, the weaker alignment only covers two partial regions of the query sequence. These two regions align to the genome on the plus strand and are separated by 494 bp (from coordinates 343,438 to 343,932). Further analysis must be conducted to find if these regions of the query correspond to particular functional domains.

BLAST outputs with SequenceServer
SequenceServer goes beyond the standard BLAST outputs. Using a variety of graphical representations, SequenceServer makes it easier to understand and leverage useful information from BLAST results. Why not try it for yourself? Sign up for a free trial and experience the power of SequenceServer!
Happy BLASTing!