Retrieving specific gene sequences from a genome assembly to create multi-gene phylogenies
Molecular phylogenies have historically been based on single-locus analyses. However, the reliability of such single-locus phylogenies is low because of biological processes such as hybridization, horizontal gene transfer, incomplete lineage sorting, gene duplication and pseudogenization. Creating “multi-locus” phylogenies that use larger numbers of genes is a great way of overcoming the limitations of single loci.
BLAST can help us obtain the gene sequences from the genomes we are interested in.
Three ways of running BLAST
The Basic Local Alignment Search Tool (BLAST, Altschul et al, 1990) has more than 100,000 citations, many of which involve retrieving gene sequences from a genome. Give BLAST a query sequence, and it will identify similar sequences in a sequence database of nucleotide or protein sequences.
Three common ways of running BLAST searches are as follows:
-
For publicly available genome and amino-acid databases, many people use the NCBI’s website. This works great for small amounts of searches. However, this free service is supported by US taxpayers. Thus, its capacity is limited, large queries are forbidden, and small queries can be delayed. Furthermore, NCBI includes only public data: you cannot use their website on unpublished or proprietary databases. Finally, some people are wary of running private R&D queries on website managed by the U.S. government.
-
For unpublished or proprietary databases an alternative has been to use command-line BLAST on a local server. Indeed, NCBI provides the command-line tools needed to create a BLAST database from a FASTA file and to run BLAST searches on any UNIX computer. However, this requires an appropriately powerful and appropriately configured UNIX server, and sufficient knowledge of the command-line. The lack of a graphical user interface makes this even more difficult. Furthermore, if a BLAST search finds hit sequences, it will output huge amounts of text. This can be overwhelming to filter through and make sense of. Things get particularly complicated if there are multiple hits and multiple aligning pieces per hit.
-
Another way of running BLAST on unpublished or proprietary data is to use SequenceServer. It provides an handy and intuitive graphical user interface to run and interpret BLAST results, and includes multiple graphs that help interpretation. Some teams install it on their own UNIX server, while others just point-and-click using the secure SequenceServer Cloud BLAST service.
Below, we use SequenceServer to find and retrieve FASTA sequences of genes from a set of new genome assemblies. Specifically, we are identifying homologs to five particular candidate single-copy genes.
Retrieving individual gene sequences using BLAST
In this example, we have FASTA-format sequences of three protein-coding genes from the domestic cow Bos taurus that we retrieved from the ENSEMBL gene database. For each gene, we aim to retrieve the orthologous genes in each of five unpublished genome assemblies of closely related species of Bovids.
Once we’ve added the FASTA files for the genome assemblies to SequenceServer, the software automatically converts them into BLAST databases. And our SequenceServer BLAST instance presents the following view:

BLASTing gene of interest against a custom database
We paste our FASTA format gene sequences into the text box and select the genome we want to BLAST against. SequenceServer automatically recognizes the query type and selects the appropriate BLAST algorithm. In this case, we are BLASTing nucleotide sequences against a nucleotide database, thus SequenceServer will automatically select BLASTN. A breakdown of the selected algorithm for query and database type is given in the image below (taken from Priyam et al, 2019).

Increasing E-value cutoff stringency to identify one-to-one orthologs from closely related species
Modifying the E-value cutoff is the easiest manner of changing the stringency of a BLAST search. BLAST E-value is a measure of the likelihood that sequence similarity is due to random chance. Consequently, E-values can be used as a first quality filter, with values closer to 0 indicating greater similarity (which in many cases means greater homology). However, E-value depends on query length, database size, BLAST algorithm, and the biological question. Therefore, no “one size fits all” rule exists regarding which E-value cutoff is appropriate. Generally speaking:
- E-value of 1e-10 (i.e., 10-10) is generally appropriate to find distant homologs with protein queries. This is currently the default E-value cutoff for ncbi-tBLASTn.
- The default for SequenceServer is somewhat more lenient: 1e-5 (i.e., 10-5) to also find more distantly related sequences.
- Very strict E-values, say between 1e-20 and 1e-50, indicate particularly high similarity that cannot be due to chance.
Here, we are searching for orthologs: highly similar sequences in closely related species. If we use a lenient E-value cutoff, BLAST will also report similarity to paralogous sequences. To reduce the detection of paralogs and thus get cleaner results that are easier to make sense of, we increase search stringency. For this, In the “advanced parameters” box, we select a E-value cutoff of 1e-45. This stricter cutoff value will both limit the number of HSPs (aligning segments) reported by BLAST to those that are the most significant and make the outputs more legible and manageable.
NOTE: It is typically faster to run one BLAST search using multiple query sequences than to run one search per query. In SequenceServer, paste multiple queries into the dialog box, or by drag-and-drop a .fasta file containing the multiple sequences. Multiple databases can also be selected. In this tutorial, we will be BLASTing three queries (AMBN, APEH, CDAN1) simultaneously against the Bos frontalis GWH nucleotide database.
Click on the blue BLAST button on the bottom right to submit the BLAST search.

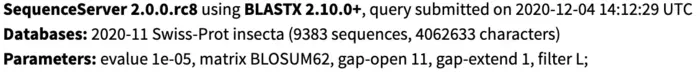
Interpreting BLAST output
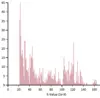
Once complete, SequenceServer will output a page similar to the one below. The top of the page reports query submission date and time, the database used (with number of sequences and characters) and the BLAST parameters used. The left of the page, shows the list of queries that we used. Each query can be selected to visualize results. For now, we will be focusing on the first query, AMBN. SequenceServer also provides a visual overview indicating how well hits align to the query sequence, and the lengths of the hit sequences. Below these charts, we find a list of the best hits, ordered by E-value. SequenceServer also reports key metrics similarly to NCBI’s web BLAST:
- Query coverage: the percent of the query included in the aligned segment.
- Total score: the sum of the alignment scores (bit-score, calculated from alignment matches and mismatches) between query and database sequences of all sequences from the same database. The alignment score is inversely proportional to the E-value, with larger scores less likely to be obtained by chance.
- Percent identity: the percentage of identical bases between the parts of the query and hit sequence that align. This number can be misleading if only a small portion of your query aligns to the hit sequence.
If instead of a web page, you want a table or an XML file that summarizes all results, you can download these by clicking on the left. They are equivalents of running blast with the options -outfmt 7 and -outfmt 16. Similar buttons enable you to download FASTA files or alignment of hit sequences.

Visualizing and selecting best BLAST hit
For each hit, SequenceServer generates a graphical overview of the aligned regions, and provides alignment statistics including score, E-value, percentage of identical bases and gaps, and strand orientation in relation to the query (+/+ or +/-). The graphical overview of hits will be familiar to everyone who has used NCBI’s web BLAST. A key difference of SequenceServer’s visualization is the color coding, with darker segments representative of stronger (i.e., lower) E-value, which is somewhat more intuitive than NCBI’s default color-coding.
The graphical overview can be used as a starting point to infer orthology of the hits in relation to the query sequence. Interpretation of our results is straight-forward: a particular segment matches the query length in its entirety (11 kbp), with strong E-value. We can hover the pointer on this black bar to visualize the name of the segment and other metrics such as E-value, % of identities and % of gaps. Weaker and shorter hits are also reported in light orange. Their weak E-value and short length indicate that the similarity to the query is not due to shared ancestry, but due to chance. We can thus disregard these hits.

In our example here, an E-value of 0 of the top hit indicates there is essentially no chance that the similarity between query and hit sequences are due to chance (note: the E-value isn’t really 0, it just gets rounded down to 0 when it is sufficiently close). The extremely high similarity of 99.5% across the entire length of the query sequence is in line with what can be expected from extremely strong recent ancestry, as occurs with one-to-one orthology across closely related species.
When we select the top hit, SequenceServer displays the name of the aligned segment of our database and its full length. In this case, this is chromosome 7 of the genome assembly we blasted against. Here this is helpful for seeing which part of the chromosome our query aligns to. When aligning to smaller genomic segments, this pairwise alignment overview indicates the order and scope of how different segments align.

Graphical overview of pairwise alignments of BLAST query and hit sequences
Several manners of visualizing BLAST results are helpful for understanding what is going on. The pairwise graphical overview of aligning regions between BLAST query and hit sequences also displays some interesting information. The dark-orange alignment labelled “a” shows that the full length of the query (top, 11 kbp) matches a particular section of the chromosome (bottom, around nucleotide 95,000,000). Another short hit (“b”, displayed in light orange) also aligns to another region of the same chromosome. By looking at the alignment of this shorter (230 bp) hit, we notice that this is a repetitive motif, most likely a SINE (short interspersed retrotransposable element). This pairwise alignment graph thus tells us two things:
- The top hit spans the entirety of the query and is very likely to be our candidate gene of interest homologous to our query. This is also supported by low E-value, and high total score and percent identity.
- To further filter out repetitive regions, we could use an even stricter E-value, such as 1e-50.

Retrieval, fine tuning and multiple-alignment of the candidate gene
The alignment of the selected hit (candidate gene) can be downloaded in FASTA format from the list on the left of the page. With a text editor, we can retrieve our candidate gene sequence along with its coordinates in the chromosome.
In the explanations above, we extracted one single gene from one particular taxon. The same logic applies for extracting additional sequences of interest from each of the taxa we wish to study.
Although BLAST can be an easy, quick, and efficient way to retrieve orthologous genes for phylogenetic analyses, this method also has some limitations. Heterozygosity, for example, is underestimated with most methods of De novo assemblies (Kajitani et al, 2019). In addition, assembly errors, especially of repetitive regions and intron/exons boundaries, can negatively affect phylogenetic inferences. A way around this is to perform a reference-based assembly of the gene sequence using BLAST outputs as a reference to map the original raw reads to. From there, high-quality consensus sequences can be retrieved. Here, I used BLAST outputs as reference to map the original raw reads against. It was a lot of manual curation and several iterations to resolve introns/exons boundaries.
Once complete, we need to perform a multiple sequences alignment with an appropriate algorithm such as MUSCLE or MAFFT, which we can then visualize with AliView.

With this method, we obtained an alignment for the AMBN gene for five closely related taxa. Ultimately, a larger number of genes and taxa is needed for a comprehensive multi-locus phylogeny. Because of evolutionary processes such as hybridization, ILS and horizontal gene transfer, different genes may differ in their phylogenetic histories and thus complicate phylogenetic inferences. The advantage of multi-locus phylogenies is that they can account for such differences (Kubatko and Degnan, 2007). Once a full MSA dataset is complete, a gene tree can be produced from each gene. The resulting trees can be compared and combined to reveal possible discordances and aid in retrieving the true species tree. Several methods and programs are available for this task, with a popular example being starBEAST2 (Ogilvie et al, 2017), which can implement Bayesian multispecies coalescent model to infer species tree from multiple sequence alignments.
References
Altschul, S. F., Gish, W., Miller, W., Myers, E. W. and Lipman, D. J. (1990) ‘Basic local alignment search tool’, Journal of Molecular Biology, 215(3), pp. 403–410. doi:10.1016/S0022-2836(05)80360-2.
Kajitani, R., Yoshimura, D., Okuno, M., Minakuchi, Y., Kagoshima, H., Fujiyama, A., Kubokawa, K., Kohara, Y., Toyoda, A. and Itoh, T. (2019) ‘Platanus-allee is a de novo haplotype assembler enabling a comprehensive access to divergent heterozygous regions’, Nature Communications. Springer US, 10(1), pp. 1–15. doi:10.1038/s41467-019-09575-2.
Kubatko, L. S. and Degnan, J. H. (2007) ‘Inconsistency of Phylogenetic Estimates from Concatenated Data under Coalescence’, Systematic Biology, 56(1), pp. 17–24. doi:10.1080/10635150601146041.
Ogilvie, H. A., Bouckaert, R. R. and Drummond, A. J. (2017) ‘StarBEAST2 Brings Faster Species Tree Inference and Accurate Estimates of Substitution Rates.’, Molecular biology and evolution. United States, 34(8), pp. 2101–2114. doi:10.1093/molbev/msx126.